-
 Tom
91About a year ago, Dave got me interested in a new handicapping idea, and I began doing some research. After several ideas failed to deliver, I went back to basics and watched some DS videos and read up on Reynolds numbers and set out to find what wins at FL and Belmont. FL was easier, no turf, only a handful of 2yo races.....I have 100 races in my model, and things are looking promising. I would like to post the sheet here and invite comments, suggestions, and share the information with the group.
Tom
91About a year ago, Dave got me interested in a new handicapping idea, and I began doing some research. After several ideas failed to deliver, I went back to basics and watched some DS videos and read up on Reynolds numbers and set out to find what wins at FL and Belmont. FL was easier, no turf, only a handful of 2yo races.....I have 100 races in my model, and things are looking promising. I would like to post the sheet here and invite comments, suggestions, and share the information with the group.
If I can't post the data here, I set up a link to it. -
 Dave Schwartz
453If I can't post the data here, I set up a link to it. — Tom
Dave Schwartz
453If I can't post the data here, I set up a link to it. — Tom
Sure.
What format do you want to post it in?
Worksheet or PDF file?
Click the Upload file button.
(Let me know if it doesn't appear on your toolbar.)
Graphics?
Just drag & drop. -
Tom
91OK, the attached spreadsheet is my model for FL race track in beautiful downtown Farmington. The data comes right off the 7 columns at the bottom of the BRIS ULTIMATE PPs, Speed last race, back speed, current class, average competitive level, prime power, early pace last race and late pace last race. I also added the E/L rankings 0r the place horse as well, out of curiosity.
The numbers were taken as is, no substitutes, no influence from me. The summary box in the upper right corner is the "7-4-1" scoring for each column. Field size is included so I can look at small and large fields.
Next step is break it down by sprint-route, and make Reynolds fields. -
 Steven
114I thought this was most interesting so I went back and reviewed WHAT WINS - Dave Schwartz and worked up the attached for the spring meet at Keeneland. I am not to the point where I could actually use this data but I thought that some one else might have an insight or three and would share.
Steven
114I thought this was most interesting so I went back and reviewed WHAT WINS - Dave Schwartz and worked up the attached for the spring meet at Keeneland. I am not to the point where I could actually use this data but I thought that some one else might have an insight or three and would share.
Most headings I hope are self explanatory but if not.... (the _# is just to help keep me straight in the code, it's not relavent to much of anything else)
TRK_1 track name
DATE_2 date of race
RACE_3 race number
ML_10 morning line odds
FINSH_15 finish
PT_ODDS_16 post time odds
WIN_17 win payoff
PLACE_18 place payoff
SHOW_19 show playoff
ML_RANK_20 morning line odds rank
PT_RANK_21 post time odds rank
PRIMEP_RANK_22 prime power rank
EP_RANK_23 early pace (my version) rank
LP_RANK_24 late pace (my version) rank
SAR_RANK_25 some combination of Sartin fps numbers (I would have to look closely to see the computations)
B_365_RANK_26 best speed in 365 days rank
BL2_RANK_27 best of last two speeds rank
TR/JO_RANK_28 combined trainer jockey win percentage rank
LRS_RANK_29 last race speed rank -
Dave Schwartz
453
This looks like good work, Steven! :clap: :clap:
It was work like this that allowed me to turn everything right side up a couple of months ago.
Much of that development was the result of working with a couple of other guys. I just cannot emphasize enough how important collaboration is.
Aside from splitting the workload, it also provides a different POV; different ideas.
Of course, Steven, our paths have crossed before. I know your work is top notch.
(Could use an extra 500 columns, maybe. LOL)
(Dang, was that my BIG DATA outlook showing through?) -
Dave Schwartz
453
Good work.
It does dominate.
BTW... Tried to straighten out your columns a little with code tags.
Will have to get some vids & screenshots going for how to use those.
Basically, write it in a text editor that lets you use COURIER (a fixed-width font), then paste it in. Finally, wrap that in "code tags." (The 5th icon from the left that looks like <>) -
Steven
114
Thank you Dave, that's very kind of you.
This is (as well as I am) still a work in progress and I hope to add to the What Wins program/spreadsheet as I go along. I'm all for massive amounts of data, I'm just not sure what would be worth putting in there. I have added Quirin Early Speed points and I'm looking for other factors to add. I don't think I'll ever get to 500 but I am already set up for about 100 (I just need factors). Anybody got something they want to look at (low level type factor, best speed at distance or track for example would be okay. Nothing that involves too many calculations)? -
 William Zayonce
41How much of an advantage ( in percentage) is needed to produce a profitable play.
William Zayonce
41How much of an advantage ( in percentage) is needed to produce a profitable play. -
Dave Schwartz
453Highest QES points percentage (of field total) might be interesting. — Zayonce William
Surprisingly, that is a very disappointing factor.
Check out the Early Speed series, if you haven't already.
You have to see it from an "out-perform the tote board" point of view.How much of an advantage ( in percentage) is needed to produce a profitable play. — Zayonce William
If you've not read this book, Percentages & Probabilities, there is a lot in it like that. -
William Zayonce
41Here's a factor that I'd like to see stats on.
Number or percentage of wins and or "good" races in past 12 ,excluding "irrelevant" races and races prior to a 90 day layoff and including/excluding QES or Speed rating rank.A high percentage ( 80% or better) has been 1 of my tools but knowing the actual long term win % would i be helpful . -
William Zayonce
41If these stats are already included in "Percentages and probabilities " please advise, I'll order a copy.
-
Dave Schwartz
453If these stats are already included in "Percentages and probabilities " please advise, I'll order a copy. — Zayonce William
Good races and some other stuff are in PAST 10 and a bunch of items in LAST 90 DAYS are included.
There are HUNDREDS of factors.
There are also those SAME HUNDREDS of factors (data tables) spread across 25 different kinds of races. Over 1,300 extra pages!
Buy it here.
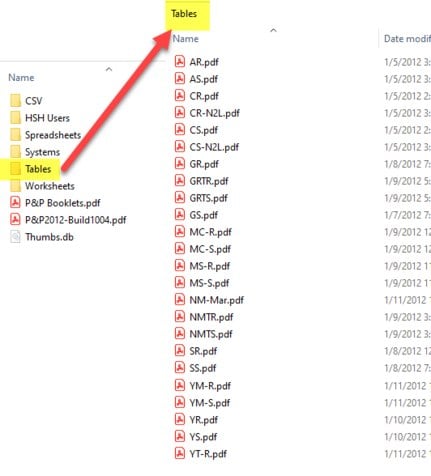
- Allowances Sprints & Routes
- Claiming Sprints & Routes (including N2L)
- Graded Sprints, Routes, Turf
- Maidens, etc.
- Young Horses
- Marathons
-
Steven
114
Zayonce, can you explain this mathmatically? I have to program this all in and I don't really follow what you're asking. -
William Zayonce
41Thanks Steven.
What Im curious about is a win percentage for entries which have a minimun of 3 good races in their last 10 with at least 1 win and boast the highest percentage of good races in the field . The other factors are finetuning( eliminating irrelevant races and races prior to a 90 day layoff.) -
William Zayonce
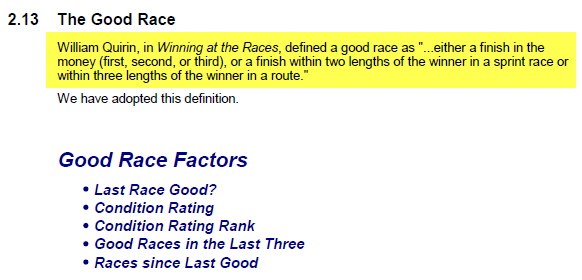
41The. Quirin definition...witin 2 lengths in a sprint or 3 lengths in a route. Steven
-
Dave Schwartz
453How would you define a good race? — Steven
Standard definition is from Dr. William Quirin (found in Percentages & Probabilities.)
-
William Zayonce
41Steven, you need not limit it to 90 days. Just dont go back beyond a 90 day layoff


Please register to see more
Forum Members always see the latest updates and news first. Sign up today.