-
 RanchWest
503You're probably all familiar with traditional past performances. Horse's name, limited lineage, jockey, trainer and earnings information, and previous races back usually to 10 races. It's all the information.
RanchWest
503You're probably all familiar with traditional past performances. Horse's name, limited lineage, jockey, trainer and earnings information, and previous races back usually to 10 races. It's all the information.
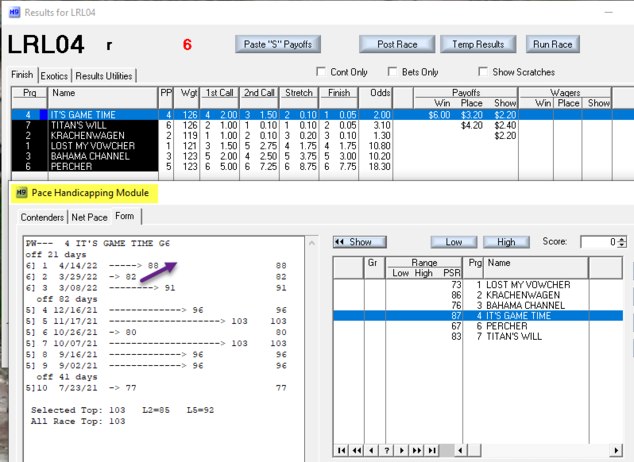
But can you glean what you need? I have my own program, so (pardon my arrogance) my past performances are some of the best around. Everything is color coded, neatly layed out. I even mesh the workouts with the races in chronological order. I use days instead of dates so I don't have to compute the days. I get only very limited usage. Probably the most useful aspect is the workouts meshed with the races, but most people don't have access to that feature. The works are usually listed on one or two horizontal lines below the race lines. So, what do I glean from my beautiful past performances? Not much.
The biggest problem with past performances is that they deal with one horse at a time. There is no visual for comparisons among horses. When Huey Mahl said that Pace Makes the Race, he clearly did not have in mind looking at one horse at a time, though a very intelligent person might be able to do it. But why? Why struggle through one horse at a time?
When I first started getting digital race data, over 25 years ago, my first thought was that I wanted to view the data TOGETHER. If I am looking at jockey data, I don't get a visual of which jockey is best by looking at the jockey of one horse. I needed to see all of the jockeys together because looking one at a time was very taxing on the brain, slow and not nearly as productive as I would have liked. Same with trainers. And horse earnings.
And how can I possibly decipher comparisons of speed, pace and form cycles looking at one horse at a time? What I need is to look at such factors in multiple ways as comparisons among horses, not to try to pull jaw teeth to get little nuggets.
And, how would I possibly decipher which factors in the PP's can be combined to indicate the likelihood of a horse performing well today? There is no efficient mechanism.
Since the PP's are devoted to single horses, there is nothing to show any tendancies of the field as a whole, which can be powerful information.
And, yes, you can notebook past performances and sift through to find patterns. But, my gosh is that slow!!!!!
Well, just wanted to give you a little to ponder. You know that whales are using computers to turn data every which way but loose. So, if you're still in the world of traditional PP's, good luck! I submit that the traditional past performance model is outdated and inefficient and conceals patterns (a needle in a haystack approach). Not that it is useless, just generally extremely inefficient. -
 William Zayonce
41Ranchwest
William Zayonce
41Ranchwest
It sounds like you have crafted a wonderfully efficient system that works well for you. Personally, I prefer the traditional PPs. They're all I've known over the years and I find it quite easy to separate the relevant from the irrelevant information ( if anything,they provide too much info) . -
RanchWest
503Ranchwest
It sounds like you have crafted a wonderfully efficient system that works well for you. Personally, I prefer the traditional PPs. They're all I've known over the years and I find it quite easy to separate the relevant from the irrelevant information ( if anything,they provide too much info) . — William Zayonce
The proof is in the pudding. If you are successful with PP's, that's what is important.
I think you are right about too much info. My worksheet has 28 columns and that includes 3 columns of odds, horse name and program #. While I do sometimes look at other data, the 28 columns are pretty much what I need to handicap a race. But there's a lot of computations behind the columns. -
 Jim Pommier
175I'm thinking time and money. To build a program to look at factors in multiple ways and to run data in something 3-dimensional versus one horse at a time would take a lot of time and money. I don't think individual horseplayers have either. If they did, do they want to commit to that kind of investment. Finally, can you build something that will work and is profitable?
Jim Pommier
175I'm thinking time and money. To build a program to look at factors in multiple ways and to run data in something 3-dimensional versus one horse at a time would take a lot of time and money. I don't think individual horseplayers have either. If they did, do they want to commit to that kind of investment. Finally, can you build something that will work and is profitable? -
RanchWest
503I'm thinking time and money. To build a program to look at factors in multiple ways and to run data in something 3-dimensional versus one horse at a time would take a lot of time and money. I don't think individual horseplayers have either. If they did, do they want to commit to that kind of investment. Finally, can you build something that will work and is profitable? — Jim Pommier
I'm not suggesting that you have to roll your own. When I get a chance, I will start a thread on a more modern approach. For now, I'll just say that today there are several sophisticated programs out there. And, Dave is about to release a new program. And, no, this is not intended to be a commercial for Dave. Just for the concept of a modern approach. I do know that Dave understands a lot about the data and the process, but I will let him sell his stuff. -
Jim Pommier
175Wow!! Very nice. A lot of data there. Like the color coding. But I see the point of your original post.
-
RanchWest
503Wow!! Very nice. A lot of data there. Like the color coding. But I see the point of your original post. — Jim Pommier
Thanks. I didn't show the top portion because it is pretty standard, mostly the common data. -
 Dave Schwartz
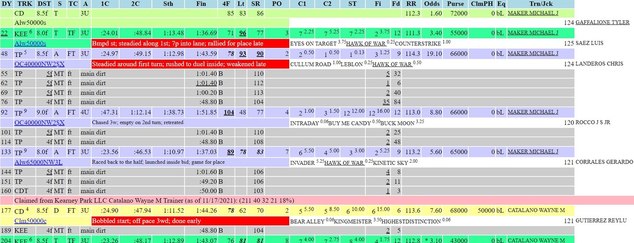
454I don't know how to directly put in a screenshot, but here is a file that shows a portion of the running lines of today's 4th race at CD for the winner, #1, Hawk of War. Hopefully I've done this correctly. — RanchWest
Dave Schwartz
454I don't know how to directly put in a screenshot, but here is a file that shows a portion of the running lines of today's 4th race at CD for the winner, #1, Hawk of War. Hopefully I've done this correctly. — RanchWest
Easiest Way
1. Save the file to your hard drive.
2. Drag and drop it into the message you are writing.
Meanwhile, you guys keep talking.
Great thread that doesn't need my interferance. -
 Jack Price
27Ranch,
Jack Price
27Ranch,
Here is an idea for you to consider… I construct my PP’s by importing data from Access to Excel… All the horses are sorted by projected early pace and at the same time, I can get a “group” comparison of all the various “factors” I deem of value for each respective race… Then, as desired, I can scroll horse-by-horse and look at individual running lines populated in the excel formula bar… The last five running lines for Hawk of War are displayed in the example race (see attachment)… For reference and pertaining to something else you mentioned, I include all recent workouts in the “LAY” column…they are also displayed in the “Formula Bar” by clicking on the layoff days for each respective horse accordingly.
I just wanted to show you this example as you’re a smart guy and if interested, you could develop something similar….
BOL,
Jack -
Dave Schwartz
454Nice work, Jack.
My favorite part is how you've utilized the tool bar (or whatever it's called).
Was that with VBA? -
RanchWest
503I construct my PP’s by importing data from Access to Excel — Jack Price
Well done, Jack!
I use Harbour to read BRIS data (Multicaps) into a dBase file, then use Harbour to write to an HTML file because I like the versatility of the output, though it is very labor intensive to write the code. I do end up with my key handicapping factors in one section. I can "quick handicap" entirely from there, but I have many sections that I can reference from a drop-down menu in case there's something I want to do a deep dive on. The downside is that it is not easy to hide or scratch horses, though I can accomplish it in a little bit of a cumbersome way. Right now the quick capping section is displayed in odds line sequence, but I am working on making each column sortable. -
 Tom
91I'm too set in my ways to stray too far from the basic format. I've been using them since Dr Fager.
Tom
91I'm too set in my ways to stray too far from the basic format. I've been using them since Dr Fager.
What I do like is the options and filters Bris Custom Generator offers. Similar to the method Michael Pizzola outlined in Handicapping Magic I use the filter to see only the races within 1 furlong of today's distance and on the same surface, set to show only races where the horse was w/in 2 lengths at the first two calls, evaluate the early pace scenario from there. I make a composite EP and SR, similar to a Qurinn pace/speed figure.
The next step I do is remove the early pace filter and view all the appropriate lines and see what closers can overcome the projected pace.
Tomorrow's 2nd at Belmont is attached in two files, the first pass and the second pass, for examples.
I found a dominant pace horse, the #1, who's 105/84 should put away all the other front runners with the exception of the $6, who cuts back off a very fast route pace. In the second pass, the #2 comes into the picture as a closer who has already won against the projected pace. -
 Tony Kofalt
410Wow!! Great topic Ranch.
Tony Kofalt
410Wow!! Great topic Ranch.
You guys are so sophisticated and have developed some amazing aids. It's no coincidence that you all found your way to Dave. I'm especially impressed by the way you've incorporated colors into your PP's. By themselves they almost add an additional layer into the PP's. They could be used to quickly identify the best early, late and class factors in a race. And many others I'm sure. Helps to deal with the one horse at a time quandary.
Let me say that I am a traditional PP guy. I print, markup and read the PP's just as my father did. I like a race to print on no more than 2-3 pages. I've accepted the traditional one horse at a time model. Some of my quirks may be positive and some I'm sure are limiting.
Comments:
Ranch:
Ranch merging workout lines in the PP"s has always intrigued me. This can be done in Formulator and probably other products. However, I've found my 'vision' when reading the PP's is interrupted so to say. It's like my visual method of reading and absorbing the PP data is broken. I know I'm missing helpful data here but I can't seem to find a comfortable and concise way to get around it. Great use of colors!
Jack:
Very impressive Jack. You've rolled up the PP lines into a pretty concise summary. I like the way pace pressure is identified on the page. At first glance I like it a lot.
Tom:
Let me first say that Tom is one of my all- time favorite posters. His work on PA and here is so valuable and often times hilarious. Tom I love the way you took products available at no or very little cost and made them more useful! I've always known these features were there but I've been too stubborn to investigate them.
This is a great topic. Hopefully I'll be able to contribute something to it. -
RanchWest
503Ranch merging workout lines in the PP"s has always intrigued me. This can be done in Formulator and probably other products. However, I've found my 'vision' when reading the PP's is interrupted so to say. — Tony Kofalt
Interesting viewpoint, Tony. I can understand it in the context of handicapping solely through the PP's. When I look at the PP's, I am usually looking for something specific, so I can usually scan to where I want to look and it isn't so much an issue for me. Mostly what I am looking for as regards works is the works since the last start or last two starts, especially the pattern for the last 40 days. But if I really want to take a deep dive, each race of the PP's includes a link directly to the chart of the race.
I also have a simpler form of PP's where there are no works and each race uses one line. I mostly look there to review for class, especially looking for stakes races and class drops. Again, I don't always refer to this section, either.
Once this thread runs its course, I plan to start a thread on the alternatives to handicapping exclusively through the traditional PP model. -
Tony Kofalt
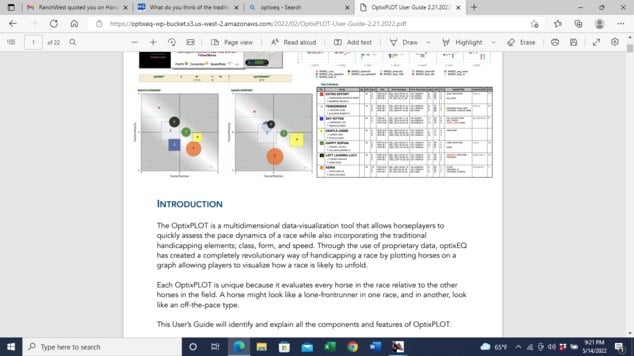
410I came across a product named OpTix which is to present an alternative to traditional handicapping. I took a brief peek at it once but never really spent time researching it. If I recall it plots the projected positions of all runners in a graph of sorts. Looked like an alternative to traditional PP's
-
RanchWest
503I came across a product named OpTix which is to present an alternative to traditional handicapping. I took a brief peek at it once but never really spent time researching it. If I recall it plots the projected positions of all runners in a graph of sorts. Looked like an alternative to traditional PP's — Tony Kofalt
I remember there being another program very similar to that, but I cannot remember the name of it. I am pretty sure it is no longer available. -
Dave Schwartz
454Ranch merging workout lines in the PP"s has always intrigued me. — Tony Kofalt
Added to my to-do list.
Might make it part of Those Sheet Like Things - as Dick Schmidt dubbed them.
OptixEQ.
I will take a look at this one.
Let me first say that Tom is one of my all- time favorite posters. His work on PA and here is so valuable and often times hilarious. Tom I love the way you took products available at no or very little cost and made them more useful! I've always known these features were there but I've been too stubborn to investigate them. — Tony Kofalt
Boy, do I agree.
If Tom decided to post here every day, the engagement would skyrocket. -
Tom
91The PP Generator can merge the works, sample below. I really hate the way they interupt the running lines with the claimed from comments. Grrrrrrrr!
Back before TFUS, CJ sold his figures to a group and one of the great things was he had a way to replace some data in the $1 files with his pace and speed figs so we could have the PPs with his numbers. -
Tony Kofalt
410
Tom- I looked at something similar years ago in BRIS. I believe that when you edit a style you can select what to display on your PP's including some user defined fields. I honestly didn't give it a good effort as I didn't want to move away from the DRF PP's. If you have the PP Generator you can probably look it up. -
Tony Kofalt
410Team,
I did a little research and found this on the OpTixEQ website. It provides an alternative view of PP data.
-
RanchWest
503I prefer numbers. The plot is too much graphically. I know you didn't ask me. — Biniak
I prefer numbers, too. Especially if they are sorted or sortable or color coded or in some one get me to the top horses quickly. The graphical approach is slightly slow for me. I don't mind it as a bonus for replays, but I don't care for the concept for handicapping. -
Dave Schwartz
454I prefer numbers, too. Especially if they are sorted or sortable or color coded or in some one get me to the top horses quickly. The graphical approach is slightly slow for me. I don't mind it as a bonus for replays, but I don't care for the concept for handicapping. — RanchWest
I prefer numbers. The plot is too much graphically. I know you didn't ask me. — Biniak
ANd I prefer numbers about the numbers.
Seriously, that is exactly what I do. -
Dave Schwartz
454How close is "The Studio" to being completed? — Biniak
Have to admit that this new "coding language" thing has tossed my timetable. Not sure but still probably within the next month.
The issue is that I'm hoping to drive almost everything with it so it may pay for itself in terms of hours spent vs. recovered. Should know more in a few day. -
Tony Kofalt
410
Dave, I can't say that I do like the plot approach. I just presented it as an alternative to RanchWest topic here. The position of the squares and circles are based on numeric ratings. The product suite also presents the numeric data in a spreadsheet.


Please register to see more
Forum Members always see the latest updates and news first. Sign up today.